Data Visualization using Chart.js in Salesforce Lightning Components

As we all know a developer is never satisfied with out of the box features of any tools and often hunts for some new means to enhance the existing functionalities. Though Salesforce provides some amazing out of the box functionalities to build reports and charts I always loved using ChartsJS for my reporting. ChartJS comes handy when we have lot of custom logic and filters to be implemented in a lightning component. The charts can be added on the pages using the App Builder’s “Standard Report Chart” component. The report filters can be used to display relevant data on the charts. This out-of-the-box component satisfies most requirements. But the filters have their limitations. ChartJS is a third-party component that provides interactive visualization components that can come handy in lightning component development.
This post will focus on building custom visualization lightning components using Charts.JS
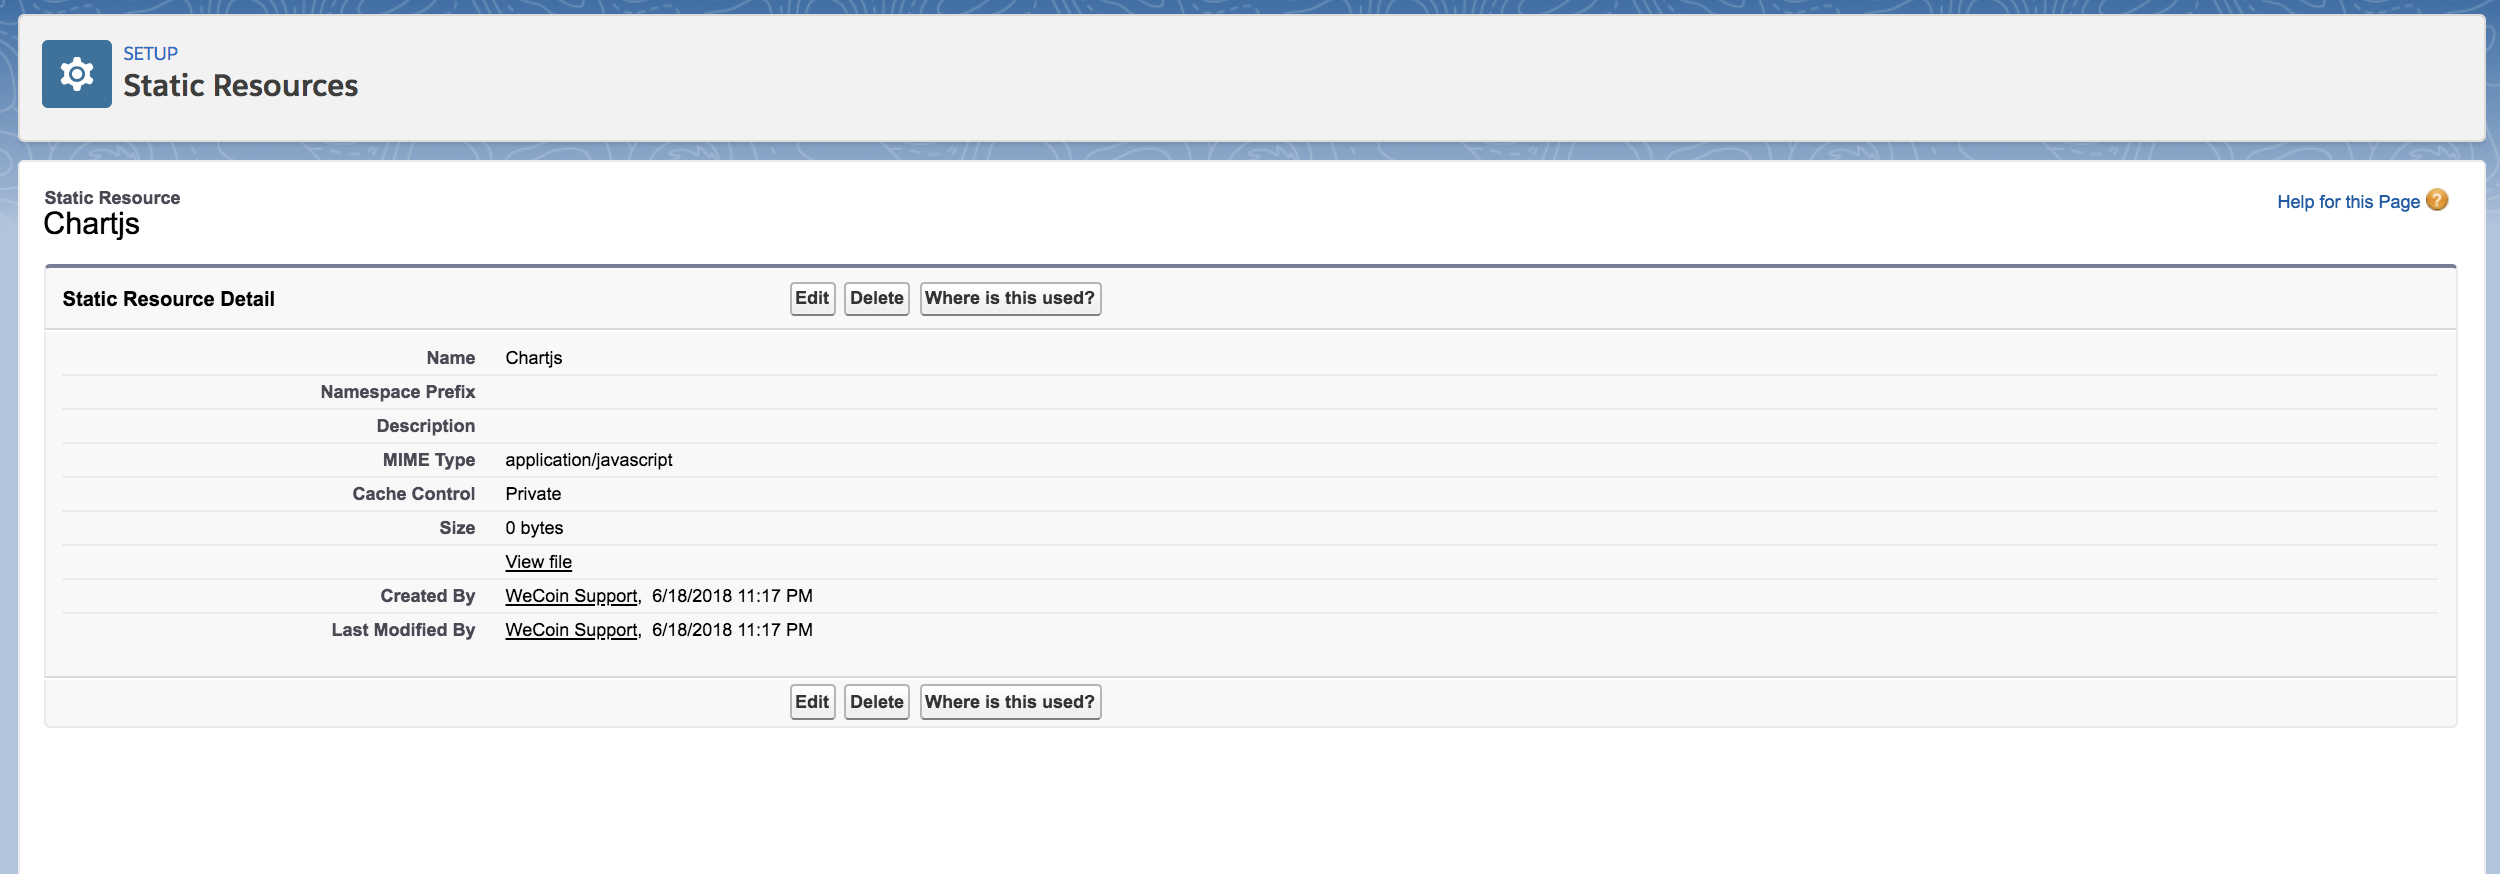
Before we create the lightning component, lets add the Chart.js library as a static resource in the org. Download Chart.js and upload it as a Static Resource.
- Go to Setup -> Static Resource
- Enter the name for the static resource; this will be used to including the library in the component.
- Upload Chart.js
Lets create a Lightning component, I named mine as Chart.cmp. Include the static resource that holds the chart.js library in the component as we include the library in the canvas element which will be used to draw the chart. All the standard attribute like the height and width of the canvas can be adjusted to fit the desired dimensions.The component code is mentioned below:

Lets create a Lightning component, I named mine as Chart.cmp. Include the static resource that holds the chart.js library in the component as we include the library in the canvas element which will be used to draw the chart. All the standard attribute like the height and width of the canvas can be adjusted to fit the desired dimensions.The component code is mentioned below:
<aura:component controller="GraphController" implements="flexipage:availableForAllPageTypes" access="global">
	<ltng:require scripts="{!$Resource.Chart}" afterScriptsLoaded="{!c.ctr}"/>

    <div class="slds-col slds-size--1-of-1 slds-small-size--1-of-2 slds-medium-size--3-of-4">
        <canvas aura:id="barChart" id="barChart" />
    </div>
    <div class="slds-col slds-size--1-of-1 slds-small-size--1-of-2 slds-medium-size--3-of-4">
        <canvas aura:id="lineChart" id="lineChart"/>
    </div>
</aura:component>
Lets mock the Json response with an APEX controller which can give us all the data to visualize inside the lightning component.
public class GraphController {

    @auraEnabled
    public List<LineChartVar> myLineChartVarList;

    public class LineChartVar {
        string label;
        integer firstValue;
        integer secondValue;

        public LineChartVar(string a, integer b, integer c){
            label = a;
            firstValue = b;
            secondValue = c;
        }
    }

    @auraEnabled
    public static Map<string, integer> getChartMap(){
        Map<string, integer> mp = new Map<string, integer>();
        mp.put('Jan', 45);
        mp.put('Feb', 50);
        mp.put('Mar', 30);
        mp.put('Apr', 36);
        mp.put('May', 42);
        mp.put('Jun', 39);
        mp.put('Jul', 41);
        mp.put('Aug', 36);
        mp.put('Sep', 43);
        mp.put('Oct', 45);
        mp.put('Nov', 33);
        mp.put('Dec', 53);

        return mp;
    }

    @auraEnabled
    public static string getLineChartMap(){
        List<LineChartVar> myLineChartVarList = new List<LineChartVar>();

        myLineChartVarList.add(new LineChartVar('2010', 10, 12));
        myLineChartVarList.add(new LineChartVar('2011', 12, 15));
        myLineChartVarList.add(new LineChartVar('2012', 17, 19));
        myLineChartVarList.add(new LineChartVar('2013', 19, 17));
        myLineChartVarList.add(new LineChartVar('2014', 21, 15));
        myLineChartVarList.add(new LineChartVar('2015', 17, 20));
        myLineChartVarList.add(new LineChartVar('2016', 18, 16));
        return JSON.Serialize(myLineChartVarList);
    }
}
Now lets call the Apex controller from our Lightning component controller. This will also enable us to set and handle the response.
({
	ctr : function(cmp, event, helper) {
        var temp = [];
        var temp2 = [];
        var action1 = cmp.get("c.getLineChartMap");
        var action = cmp.get("c.getChartMap");
        action.setCallback(this, function(response){
            if(response.getState() === 'SUCCESS' && response.getReturnValue()){
                temp = response.getReturnValue();
                helper.createGraph(cmp, temp);
            }
        });
        action1.setCallback(this, function(response){
            if(response.getState() === 'SUCCESS' && response.getReturnValue()){
                temp2 = JSON.parse(response.getReturnValue());
                helper.createLineGraph(cmp, temp2);
            }
        });
       $A.enqueueAction(action);
       $A.enqueueAction(action1);
	}
})
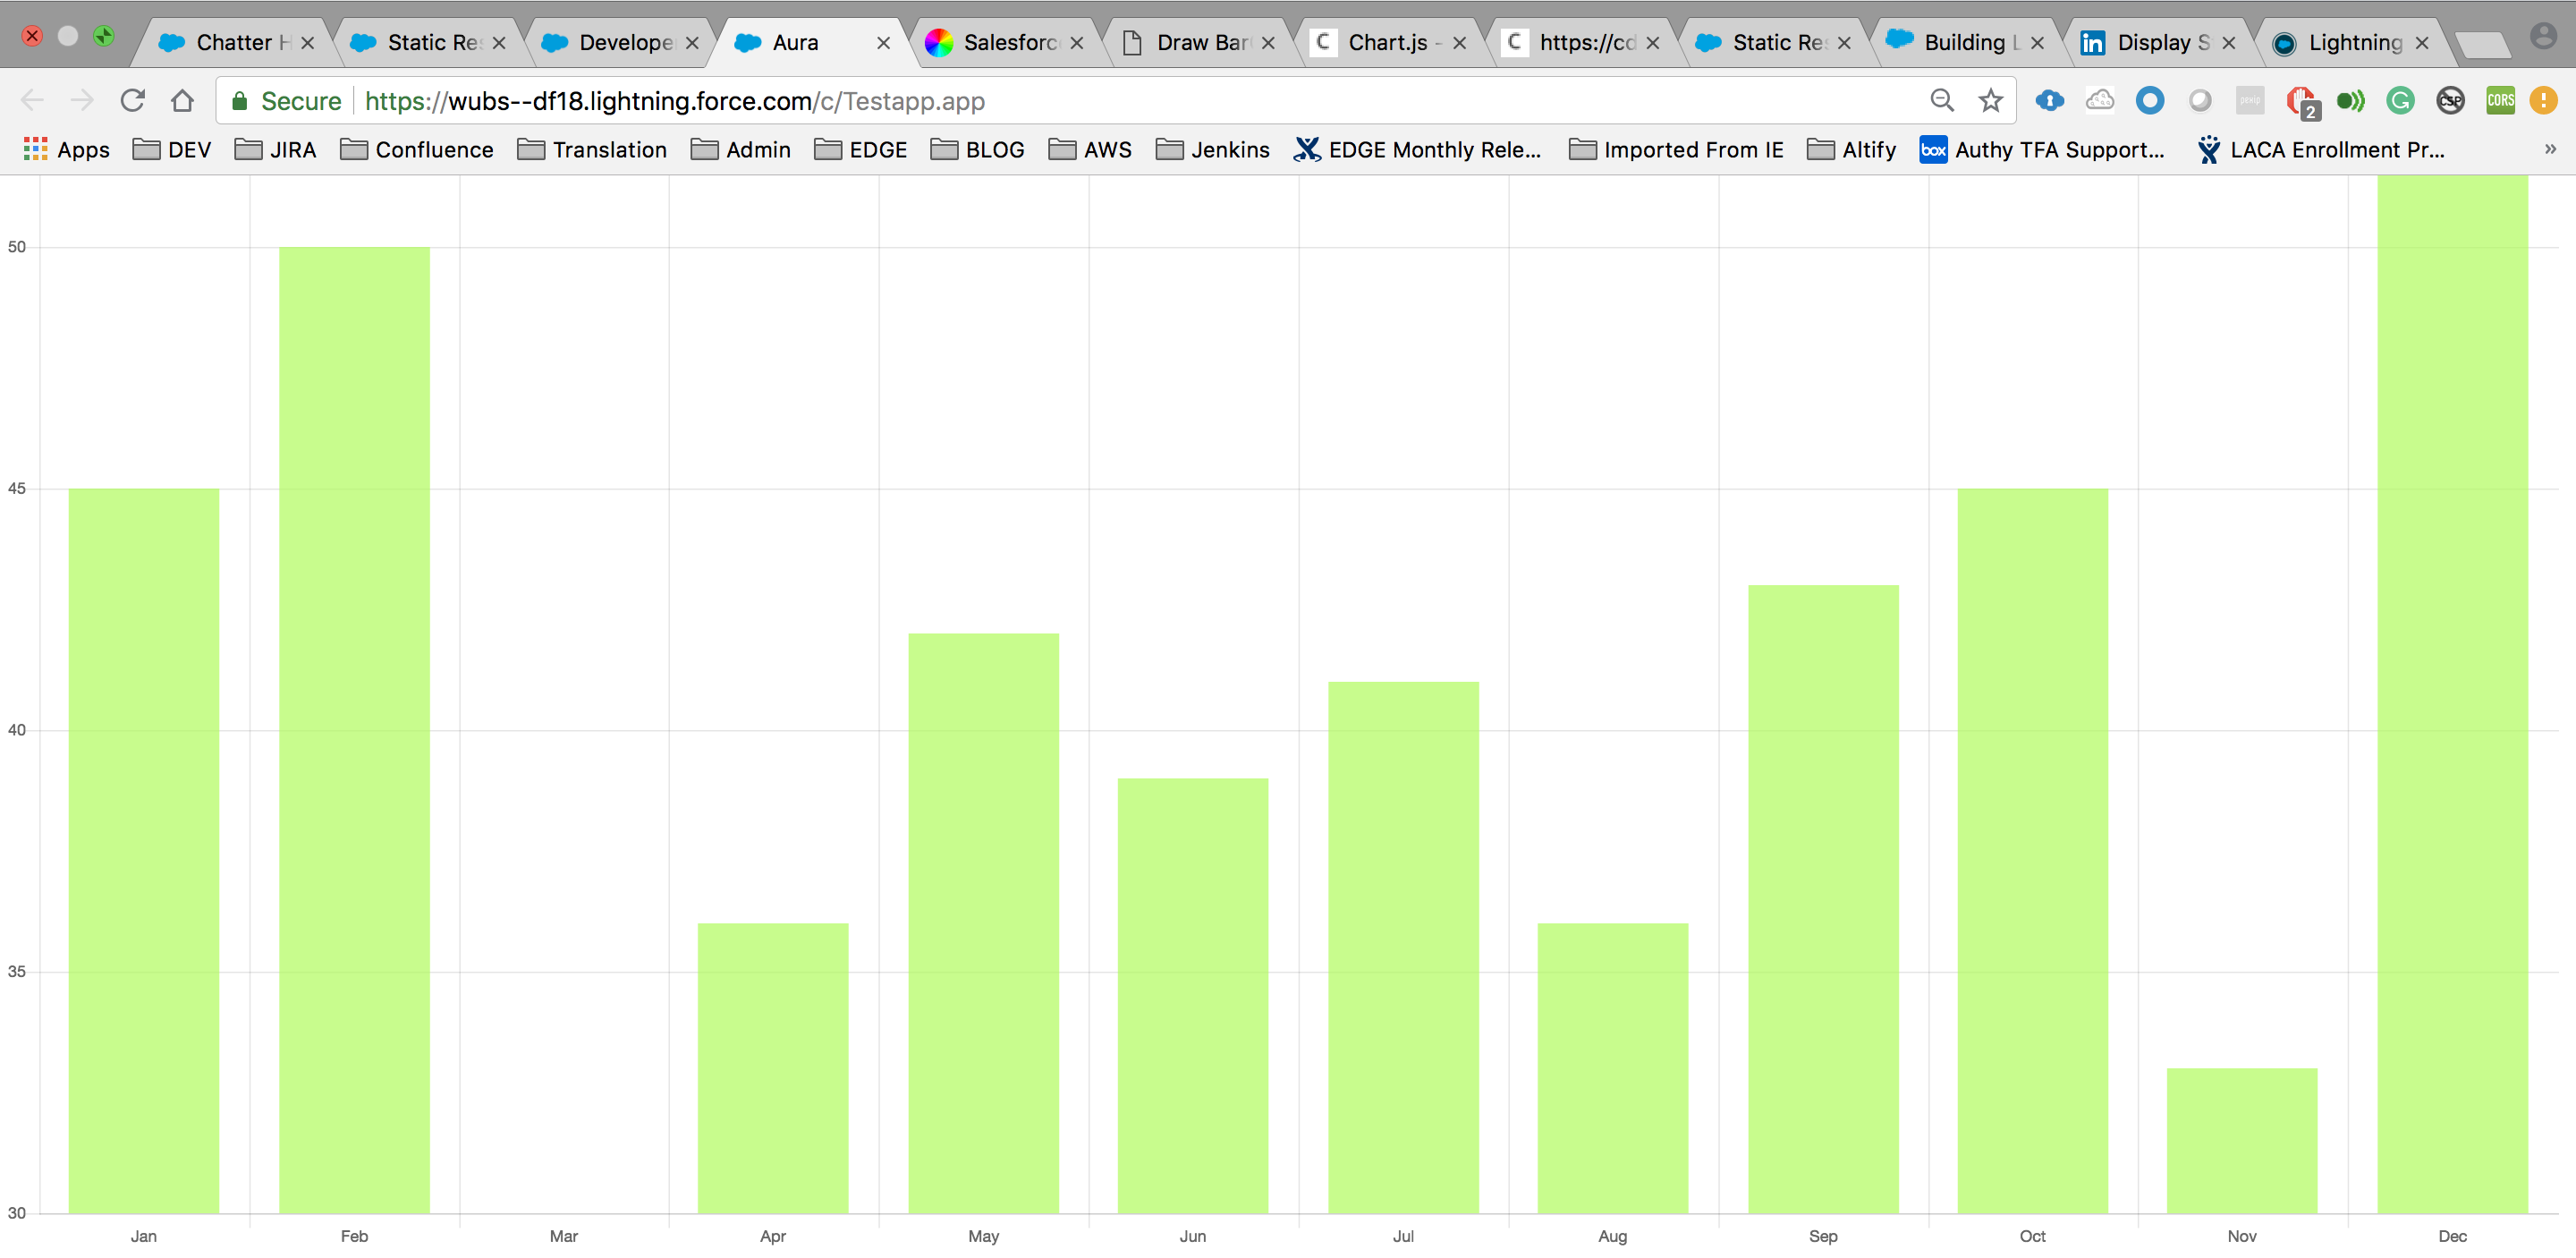
Below is the Helper function that can help us create the actual charts using the ChartJs resource we uploaded in the static resource.
({
createGraph : function(cmp, temp) {
var dataMap = {"chartLabels": Object.keys(temp),
"chartData": Object.values(temp)
};
var el = cmp.find('barChart').getElement();
var ctx = el.getContext('2d');
new Chart(ctx, {
type: 'bar',
data: {
labels: dataMap.chartLabels,
datasets: [
{
label: "Payments History",
backgroundColor: "rgba(153,255,51,0.5)",
data: dataMap.chartData
}
]
}
});
},
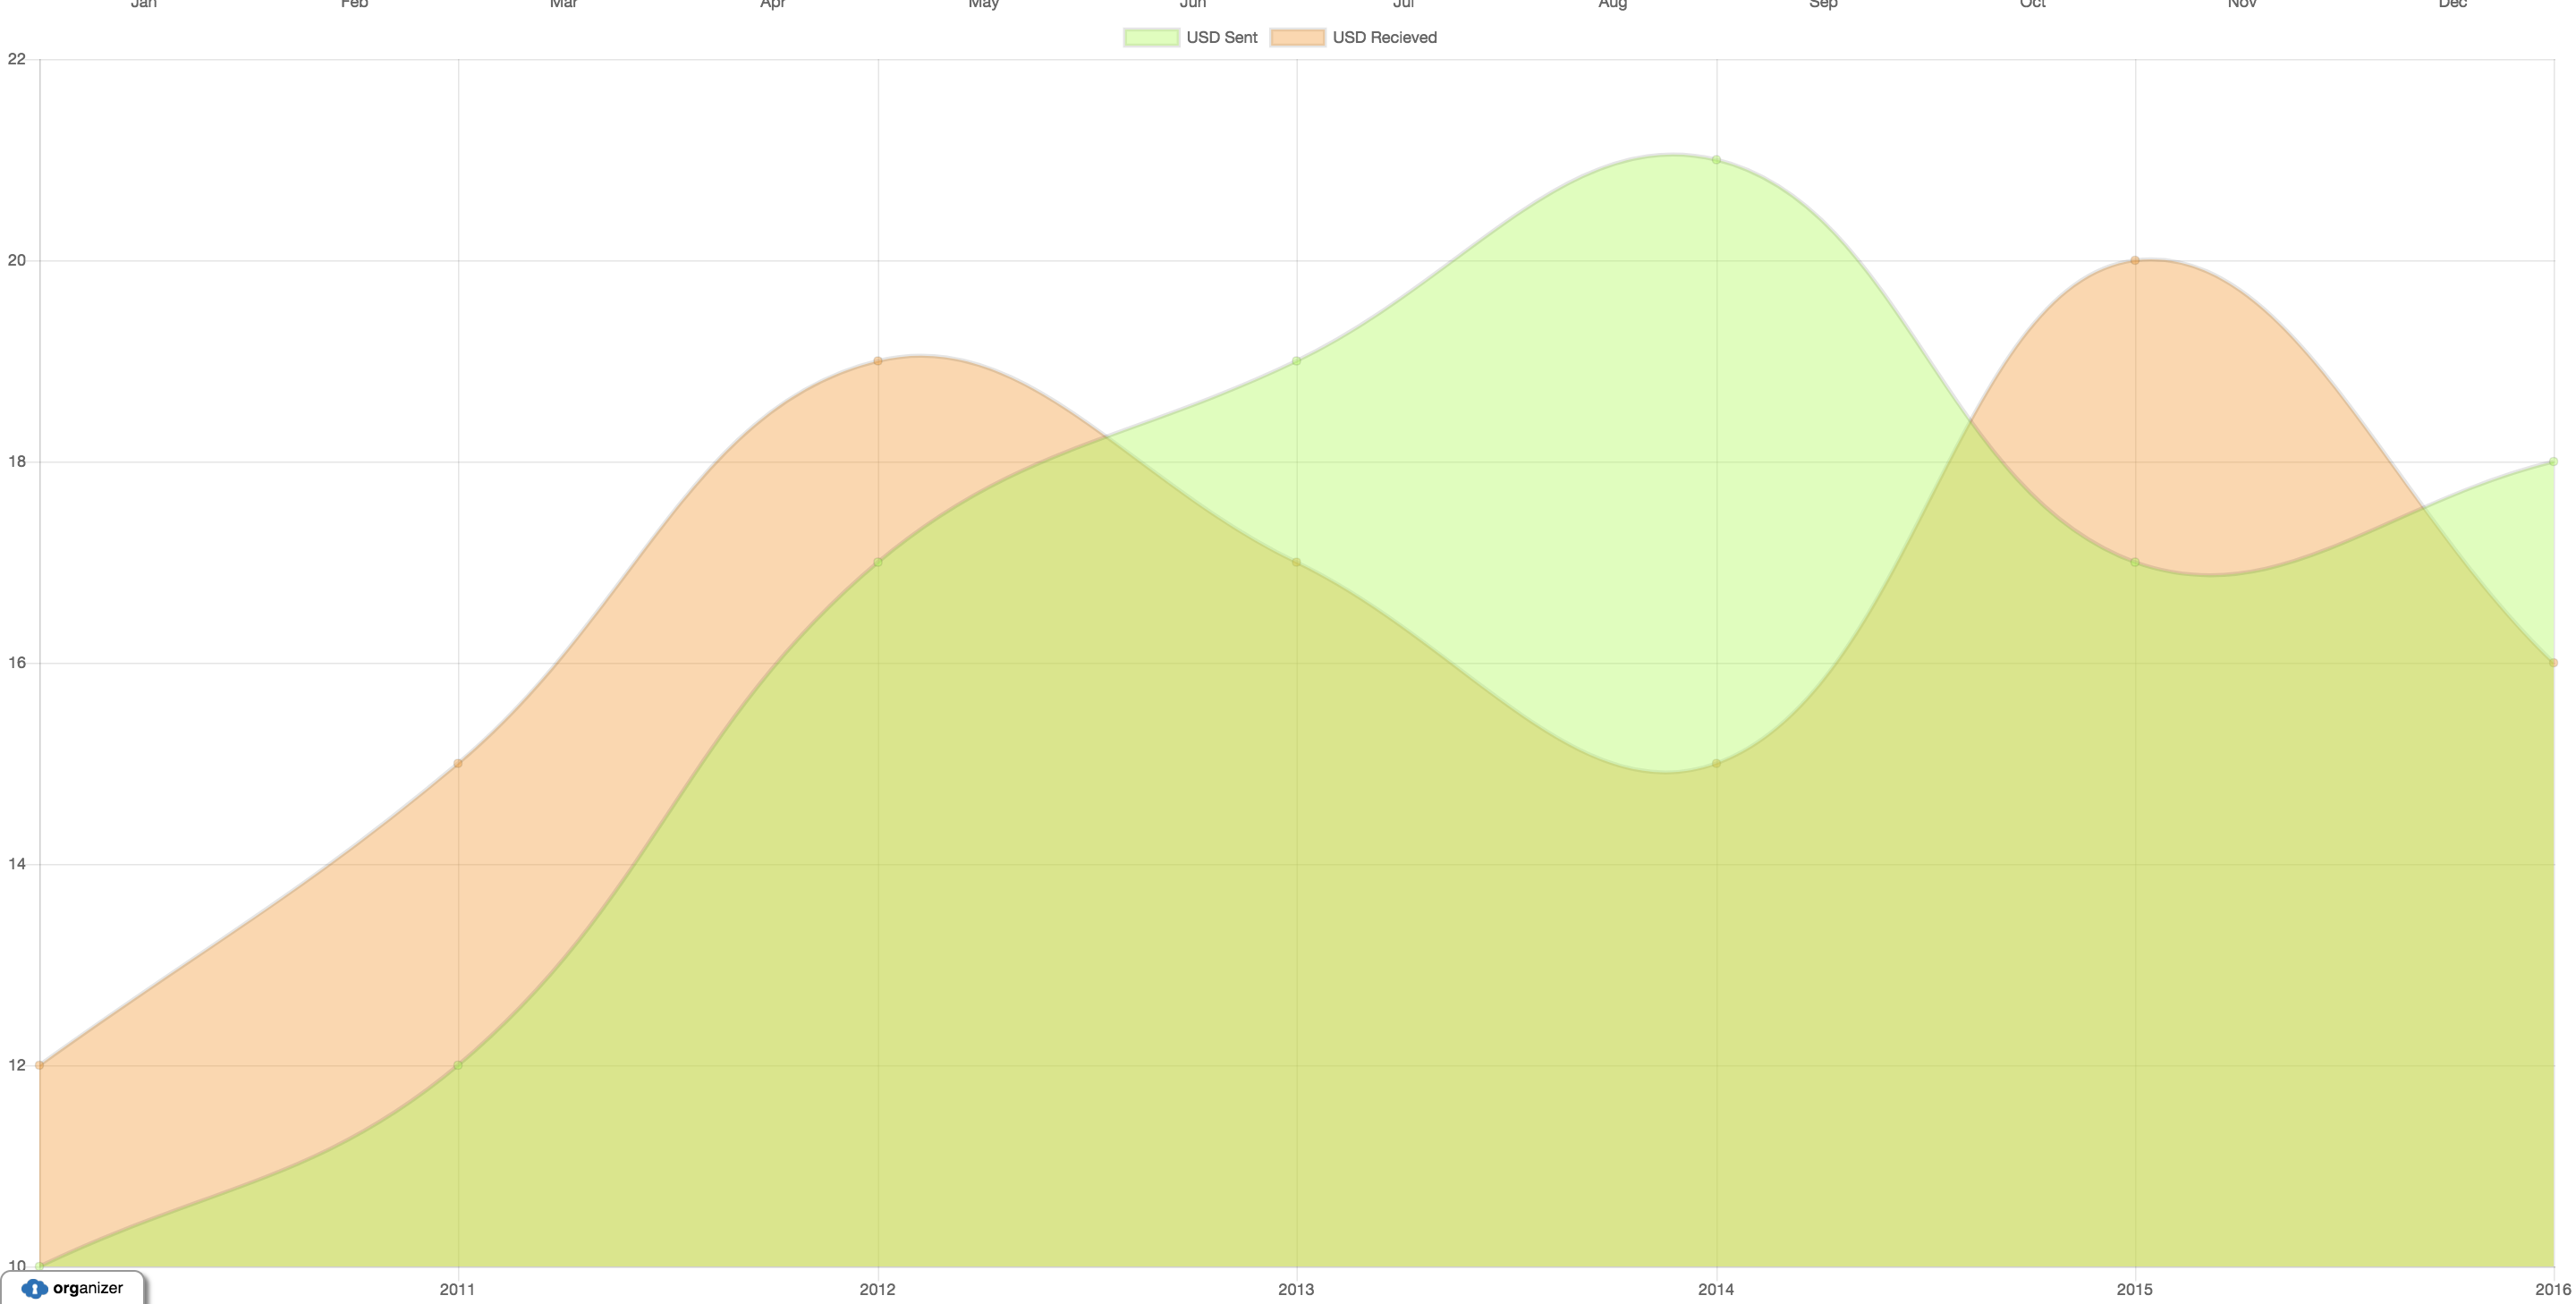
createLineGraph : function(cmp, temp) {
var label = [];
var firstValue = [];
var secondValue = [];
for(var a=0; a< temp.length; a++){
console.debug(temp[a]["label"]);
label.push(temp[a]["label"]);
firstValue.push(temp[a]["firstValue"]);
secondValue.push(temp[a]["secondValue"]);
}
var el = cmp.find('lineChart').getElement();
var ctx = el.getContext('2d');
new Chart(ctx, {
type: 'line',
data: {
labels: label,
datasets: [{
label: 'USD Sent',
data: firstValue,
backgroundColor: "rgba(153,255,51,0.4)"
}, {
label: 'USD Recieved',
data: secondValue,
backgroundColor: "rgba(255,153,0,0.4)"
}]
}
});
}
})
Voila! You can see your chart live in action now inside the lightning app. To be able to access this component in Lightning app build make sure your that the component implements=”flexipage:availableForAllPageTypes” which allows the components to be embedded in the lightning flexipages.
Github repository is available here