Event Monitoring on Salesforce
Event monitoring is an API-only feature. It isn’t anywhere in the Setup area. Instead, each organization’s event log files are stored in an API object called EventLogFile. Salesforce provides an API tool called Workbench that lets you access your EventLogFile objects. vent monitoring provides tracking for lots of types of events, including:
- Logins
- Logouts
- URI (web clicks in Salesforce Classic)
- Lightning (web clicks, performance, and errors in Lightning Experience and the Salesforce mobile app)
- Visualforce page loads
- API calls
- Apex executions
- Report exports All these events are stored in event log files. An event log file is generated when an event occurs in your organization and is available to view and download after 24 hours. The event types you can access and how long the files remain available depends on your edition.
Event monitoring can be used to:
- Monitor data loss
- Increase adoption
- Optimize performance
Lets take a scenario where you start to see business going down after one of your employee leaves the company. Event monitoring comes handy here to track any abnormal activity of the ex-employee who left the company. Event monitoring requires the “API Enabled” and “View Event Log File” permissions.
Lets start our investigation by logging into our very own Workbench
-
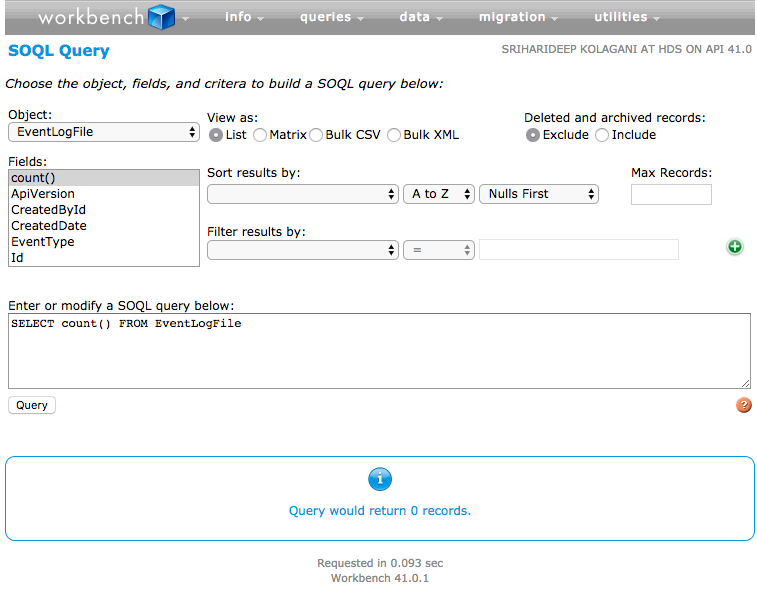
select queries SOQL Query. - Under Object, choose EventLogFile. Under Fields, select count(). Notice that the editor populates with some query text.
- Click Query.
There are a total of 15 fields in the object. EventType and LogFile are the crucial ones though.

There are a total of 15 fields in the object. EventType and LogFile are the crucial ones though.
- EventType: This field displays which event types a record represents. If you expand EventType, Picklist Values, you can see the different types of events. In our case, we’re interested in records with an EventType of Report Export.
- LogFile: This field is where the actual information you’re looking for is stored. The contents of a log file depend on the EventType. For Report Export, this field stores everything from the ID of the user that exported the report to the browser and operating system that they used to do it. You can also view the events through REST explorer: View Events in the REST Explorer The REST Explorer gives you access to the Salesforce REST API, a web service that lets you retrieve data from your organization. To get more information about your organization’s Report Export events in Workbench:
-
In the top menu, select utilities REST Explorer. - Replace the existing text with /services/data/v41.0/query?q=SELECT+Id+,+EventType+,+LogDate+,+LogFileLength+,+LogFile+FROM+EventLogFile+ WHERE+EventType+=+’ReportExport’
- Click Execute.
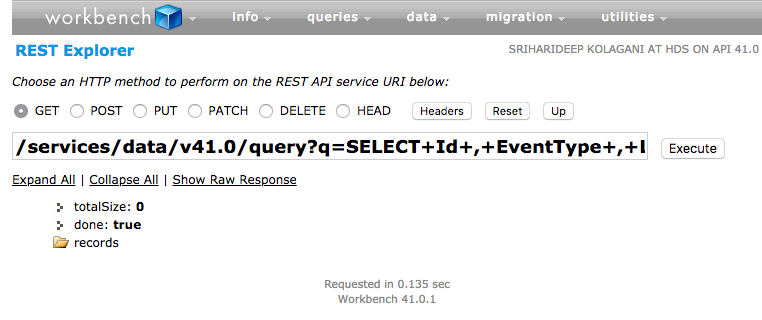 If no reports have been exported from your organization in the past 24 hours, the totalSize field has a value of zero. Remember that it takes 24 hours for events to become available. You can export a report from your organization and try again tomorrow. Alternatively, you can replace ReportExport with a different event type in your REST query (for example, Login).
If you have some report export events, your execution returns something like this:
If no reports have been exported from your organization in the past 24 hours, the totalSize field has a value of zero. Remember that it takes 24 hours for events to become available. You can export a report from your organization and try again tomorrow. Alternatively, you can replace ReportExport with a different event type in your REST query (for example, Login).
If you have some report export events, your execution returns something like this:
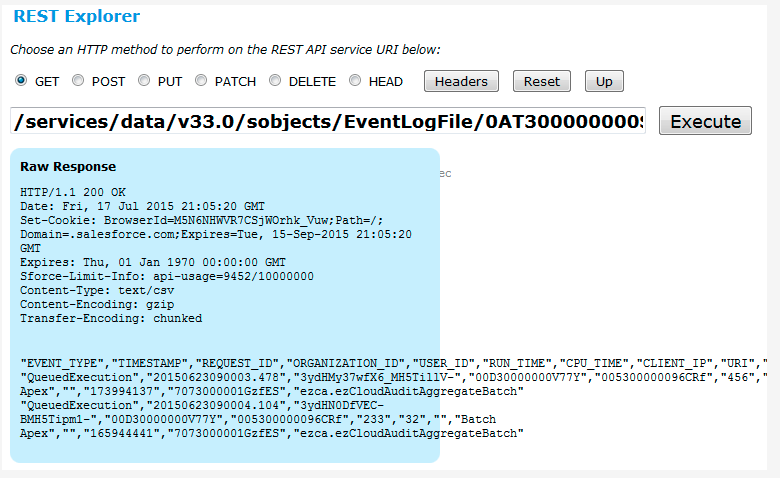
Why are using REST if we can use a SOQL query? we see the other major difference between SOAP and REST when it comes to querying event log files. The returned log files are the same, but they’re presented in different formats. When you retrieve your event log files using SOAP, the result is a serialized, Base64 string. If your organization plans on using tools like Informatica to work with event log files, you want to use SOAP to retrieve your data. REST, on the other hand, deserializes the log file. It’s still not pretty, but as you’ll see in the upcoming section, other tools can transform the REST results into an easy-to-read format.
You can download event log files in several ways, including:
- Direct download via the Event Log File browser application
- cURL script
- Python script
Download Logs from Your Browser
Using the event log file browser application is the most straightforward approach to downloading your organization’s event monitoring data. Let’s check it out.
- Log in to your Trailhead DE organization.
- Navigate to the event log file browser application
- Click Production Login.
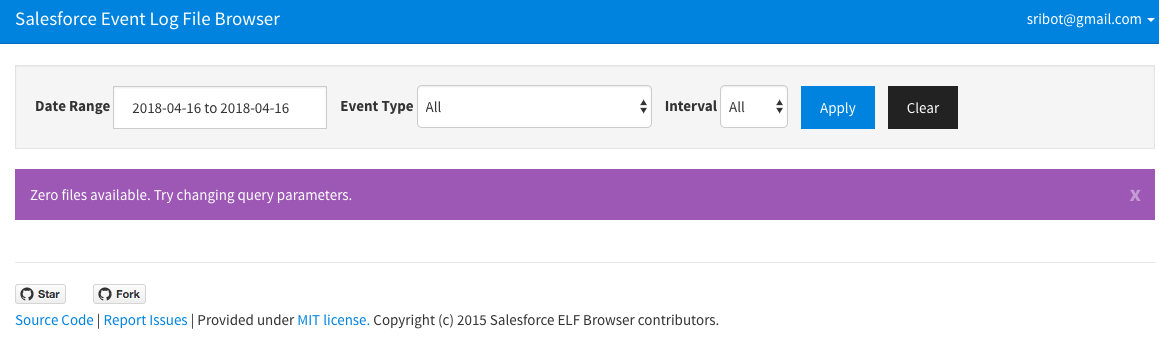
- Enter a date range for your search.
- Enter an event type for your search.
- Click Apply.
You’ll see something like this:

Download Event Log Files Using cURL Using a cURL script to download your event log files requires the following:
- Providing your Salesforce credentials
- Logging in using OAuth and getting an access token
- Using a REST query to specify which logs you’re looking for If you’re scheduling a recurring download, this step is important. You can use something like this query to filter events by the current day.
https://${instance}.salesforce.com/services/data/v34.0/query?q=Select+Id+,+EventType+,+LogDate+From+EventLogFile+Where+LogDate+=+${day}
Download Event Log Files Using Python
If you need a more programmatic way of downloading your organization’s event log files, you can use Python scripts. One advantage of using a Python script over a cURL script is that it’s easier for Windows users to work with, but it’s also suitable for Mac and Linux users. Check this blog post
Visualize Event Log File Data
Event Monitoring Analytics App Splunk App for Salesforce FairWarning CloudLock and CloudLock Viewer New Relic Insights